A retail chain or private label producer orders several thousand tonnes of frozen fruit, concentrate, milk, meat or a grain-based component. In addition to price and quality parameters, it asks for the carbon footprint of the batch, farm data, field geolocation, treatment history, certificates, compliance with customer requirements and the ability to prepare a report for a supplier scorecard. A processor with data in an MRV system can respond within days. A processor that reconstructs the same information from emails and spreadsheets loses time, credibility and margin.
MRV in food processing is a system of data, processes and controls that combines the monitoring, reporting and verification of information on raw material, farms, batches, quality, emissions and risks in the food supply chain.
In brief
MRV is no longer an ESG report prepared once a year. It is becoming the operational evidence layer for sales, audits, traceability, financing and customer relationships. For a processor, the key question is no longer: “do we have the documents?”, but rather: “can we quickly prove where each batch comes from and what data supports its value?”.
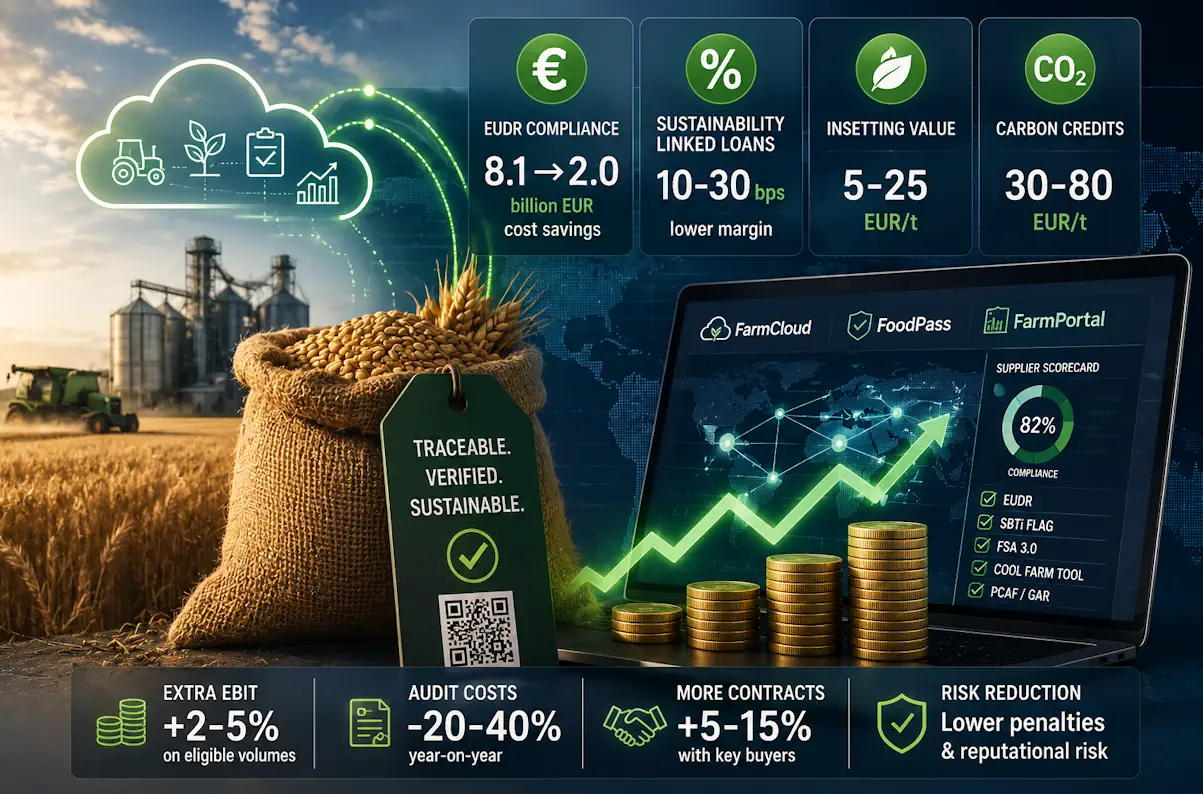
- The European Commission estimates that EUDR simplifications reduce annual compliance costs from around EUR 8.1 billion to around EUR 2.0 billion, or by approximately 75%.
- In sustainability-linked loans, the margin mechanism often works through a step-up or step-down calculated in basis points; market examples range from a few to several dozen bps, and for a processing plant it is worth testing a 10–30 bps scenario.
- Studies on winter wheat in Poland showed an average of around 0.41–0.48 kg CO2e/kg of grain, which means that moving from default data to primary data can materially change a product’s result.
- Insetting and regenerative agriculture programmes, such as initiatives by Nestlé, FrieslandCampina and Cargill, combine farm data, financial incentives and Scope 3 reductions.
- FoodPass, FarmPortal and FarmCloud can connect farm, field, batch, quality, audit and reporting data into one operational model.
What is the real cost of missing MRV?
The lack of MRV becomes costly when a processor cannot substantiate data that matters to a customer, auditor, bank or regulator. The biggest loss does not always appear as a fine. More often, it is hidden in a lower price, a lost contract, a longer audit, a missed premium or worse access to finance.
In practice, a plant without MRV has a weaker answer to the questions increasingly appearing in purchasing requests: where the raw material comes from, which farms supplied it, what treatments were applied, whether the data is linked to the batch, whether it can be verified and whether the carbon footprint result is based on primary data.
The difference is simple. Without MRV, a processor says: “we buy from trusted farmers, we have documents and good quality”. With MRV, it can say: “each batch is linked to a farm, a field, treatment history, fertilisation, test results, harvest date, transport, warehouse and production batch”.
This changes the negotiating position. The first sentence is a declaration. The second is evidence.
Main channels of loss without MRV
- Loss of contracts with retail chains and large customers. If a customer requires data on origin, Scope 3, EUDR, quality and suppliers, and the plant responds with spreadsheets collected after the fact, it loses credibility as a partner.
- Selling as a commodity raw material. Without data, frozen strawberries, milk, meat, juice, vegetables or concentrate are easy to compare mainly on price.
- More expensive audits and more manual work. Without a system, data is collected through phone calls, emails, photos, scans, forms and outdated spreadsheets.
- Risk of delays, complaints and documentation blocks. Incomplete data can stop acceptance, prolong inspection or force additional explanations.
- A weaker position in financing. Banks, investors and grant providers increasingly ask about ESG data, emissions, supply chain risks and measurable investment outcomes.
- Loss of control over the narrative. If a company does not have its own data, its environmental impact is described by the customer, auditor, regulator, industry organisation or a competitor.
| Area | Without MRV | With MRV | Financial effect |
|---|---|---|---|
| Customer data | Declarations, questionnaires, emails and files collected after the fact. | Data linked to the farm, field, batch and document. | Lower risk of losing a contract and a shorter B2B sales cycle. |
| Supplier scorecards | Assessment may be based on averages or default data. | Assessment can use the supplier’s primary data. | A stronger position in tenders where ESG and Scope 3 are scored. |
| Traceability | Batch history is often reconstructed manually. | The batch is linked to the supplier, field, transport and production. | Lower audit, complaint and documentation-block costs. |
| Financing | The company shows policies and declarations, but has little operational data. | The company shows KPIs, data history and measurable actions. | Stronger arguments for credit, leasing and investment finance. |
| Sales | The product competes mainly on price, quality and availability. | The product has proof of origin, control and environmental data. | A better chance of premium, private label and export contracts. |
Source of table: FarmCloud’s own analysis based on B2B purchasing requirements, the logic of CSRD, EUDR, traceability and Scope 3 reporting. The table is practical in nature and does not constitute legal interpretation.
Why are supplier scorecards redefining supplier assessment?
A supplier scorecard is a supplier assessment card in which the customer compares not only the price and quality of the product, but also environmental data, raw material origin, supply chain risks, traceability level and the ability to provide information for ESG reporting. For a processor, this means that missing data can lower the assessment of an offer even when the product is price-competitive.
In practice, a large customer may ask about the share of primary data, the boundaries of carbon footprint calculations, the Scope 3 methodology, the type of emission factors, farm geolocation, certificates, test results and supplier control. If the processor does not have source data, the customer may use average, sectoral or default indicators.
This does not necessarily mean that the product is worse. It does mean, however, that the company cannot demonstrate its advantage. In a tender, what matters is a documented result, not the purchasing team’s conviction that “our farmers do it well”.
What does a B2B customer most often assess?
- the share of deliveries linked to a specific farm and field,
- the completeness of treatment and fertilisation history,
- the availability of data for Scope 3 in food processing,
- the consistency between the raw material batch and the production batch,
- the validity of supplier documents and certificates,
- the time required to prepare an audit pack,
- the ability to export data to the customer’s format, such as XML, JSON or a proprietary scorecard.
This is exactly where MRV becomes a sales tool. The system not only collects data, but shortens the path between an event on the farm and a response to the customer. The less manual reconstruction is needed, the lower the risk of error.
What figures should a processing plant CFO know?
A finance director does not buy MRV because it sounds modern. They buy it when they see an impact on revenue, margin, cost of capital, audits, raw material premiums and the risk of losing a contract. That is why an article about MRV must talk about money.
| Mechanism | Figure or range | Meaning for the processor | Source / status |
|---|---|---|---|
| EUDR simplification | around EUR 8.1 billion to around EUR 2.0 billion in annual compliance costs | The regulation remains operationally costly despite simplifications. Traceability and origin data do not disappear. | European Commission / ESG Today, 2026 |
| Margin reduction in SLLs | 10–30 bps scenario; lower ratchets are also seen in market transactions, for example 2.5–15 bps | For a PLN 30 million loan, a 10–30 bps difference means around PLN 30,000–90,000 per year. | Financial benchmark to be verified with the bank |
| Wheat and CO2e footprint | around 0.41–0.48 kg CO2e/kg of grain in studies on winter wheat in Poland | The difference between default and primary data can materially change the footprint of the final product. | Syp et al., Polish Journal of Environmental Studies, 2015 |
| Carbon credits | low-quality projects may be worth a few EUR/t, while high-quality removals and projects with robust MRV can reach several dozen EUR/t | Without MRV, a carbon project is hard to sell or is valued poorly. | Market benchmark, requires updating before an investment offer |
| Insetting in agriculture | payment scenario of EUR 5–25/t CO2e or payments per practice / hectare | The processor can finance reductions among its own suppliers and account for the effect in Scope 3. | Benchmark based on regenerative programmes by Nestlé, FrieslandCampina, Cargill and similar initiatives |
Editorial note: some values in the table are publicly described institutional data, while others are market benchmarks and calculation scenarios. Before using them in a commercial offer, pitch deck or investor report, they should be verified for the specific customer, bank, product and methodology.
Financial example: PLN 30 million investment loan
If a processor finances the modernisation of a production line with a PLN 30 million loan, a 10 bps difference in margin means around PLN 30,000 per year. A 30 bps difference means around PLN 90,000 per year. Over a five-year financing period, this gives an indicative PLN 150,000–450,000 impact on interest cost, excluding the changing loan balance, fees, taxes and repayment structure.
Financial example: a 4,000 t raw material contract
If a plant sells 4,000 t of product and MRV data helps defend even PLN 20–40/t of margin in a B2B contract, the effect is PLN 80,000–160,000 on a single agreement. This is not a guaranteed premium for merely having a system. It shows the scale at which data can influence negotiations when a customer compares suppliers on more than price alone.
Financial example: audit and manual work
If preparing an audit pack takes six days of work by several people and falls to two days after MRV implementation, the saving does not end with labour hours. More important is the ability to respond faster to a customer’s question, reduce errors and lower the risk of a batch being held because of missing documentation.
SBTi FLAG, PCAF, GAR, FSA and Cool Farm Tool: why do they appear in customer discussions?
Large customers rarely ask about “being green” in general terms anymore. They ask about the standard, methodology, data level and report format. That is why a processor should know at least a few mechanisms that appear in discussions with retailers, corporate customers, banks and auditors.
SBTi FLAG
SBTi FLAG (Forest, Land and Agriculture) concerns emissions and removals related to forests, land use and agriculture. SBTi indicates that companies in sectors such as food production, food and beverage processing and food retail should set FLAG targets if FLAG emissions are material to their profile. For a processor, this means one thing: the customer may ask for data on fields, fertilisation, feed, deforestation and farming practices because it needs them for its own climate targets.
PCAF and GAR
The Partnership for Carbon Accounting Financials (PCAF) structures the way financial institutions approach financed emissions. The Green Asset Ratio (GAR) is an indicator showing the share of EU Taxonomy-aligned assets in a specified part of a bank’s exposures. For a processor, this means that a bank may ask not only about financial performance, but also about environmental data, the investment project, emissions and reporting credibility.
SAI Platform FSA
The Farm Sustainability Assessment (FSA), developed by SAI Platform, helps food companies assess, improve and verify the sustainability of agricultural practices in their supply chains. This matters because many customers recognise FSA as a practical language for working with farmers. A processor with digital records of fields, treatments, documents and deliveries is better prepared for such an assessment.
Cool Farm Tool
Cool Farm Tool is a tool for calculating carbon, water, biodiversity and food-loss impacts in agricultural chains. Its significance for a processor lies in the fact that it requires farm-level input data: yield, area, fertilisers, fuel, energy, transport and production practices. Without structured records in an FMS, the calculator remains just another form to be filled in manually.
| Mechanism | Who asks? | What data is needed? | Why does MRV help? |
|---|---|---|---|
| SBTi FLAG | Food corporations, retail chains, global brands. | Agricultural emissions, deforestation, land use, crop production practices. | It links field, supplier and product data with the customer’s climate target. |
| PCAF | Banks and financial institutions. | Emissions, company activities, data for assessing the financed portfolio. | It increases data credibility in financing discussions. |
| GAR | Banks reporting exposure to EU Taxonomy-aligned assets. | Data on the investment, activity, efficiency and compliance with criteria. | It helps document the investment project and its effects. |
| SAI Platform FSA | Food buyers and companies in the supply chain. | Agricultural practices, documents, safety, environment, workers. | It digitises data that would normally go into questionnaires and audits. |
| Cool Farm Tool | Corporations, advisors, climate projects and agri-food companies. | Yield, fertilisers, fuel, energy, transport, practices and farm data. | It provides input data for calculating the farm’s carbon footprint. |
How do CSRD, EUDR, CSDDD and Omnibus affect processors?
Regulations do not affect processors only directly. They often operate through a cascade: a large company reports, so it requires data from its supplier; the supplier requires it from the farm; the farm must keep records in a way that can be checked.
CSRD and customer reporting pressure
The Corporate Sustainability Reporting Directive (CSRD) increases the scope of sustainability reporting in the EU. The European Commission indicates that the first companies covered by CSRD apply the new rules for the 2024 financial year, in reports published in 2025. For a processor, this means more requests from customers that need data for their own disclosures.
Current information on CSRD rules is published by the European Commission in its section on company reporting.
EUDR and origin geolocation
The European Union Deforestation Regulation (EUDR) applies to selected commodities and products: cattle, cocoa, coffee, palm oil, soy, rubber and wood. As of May 2026, the European Commission gives the application dates as for large and medium-sized operators and for micro and small operators.
Current dates and the scope of the regulation are described by the European Commission in its section on deforestation-free products.
EUDR does not mean that every fruit and vegetable or dairy processor is automatically subject to the same obligation for every product. It does, however, require an analysis of ingredients, feed, raw materials and trading relationships. If soy, cattle, cocoa, coffee, palm oil, rubber or wood appears in the chain, origin data can become critical.
CSDDD and due diligence in value chains
The Corporate Sustainability Due Diligence Directive (CSDDD) entered into force on . It concerns responsible corporate conduct in companies’ own operations and global value chains, including the identification and mitigation of negative impacts on the environment and human rights.
For a processor, the practical conclusion is simple: supplier data can no longer end with the company name, bank account number and quality declaration. Documents, origin, risk, verification status and the history of corrective actions are becoming increasingly important.
EU Omnibus 2025/2026 and an honest caveat
In February 2025, the European Commission published the Omnibus simplification package, covering, among other areas, CSRD, CSDDD, the EU Taxonomy and CBAM. In 2026, the EU institutions continued work on simplifying reporting and due diligence obligations. The scope of companies directly subject to obligations may therefore change over time.
This does not remove purchasing pressure. Even if some SMEs are not directly subject to reporting obligations, large customers may still require data from suppliers because they themselves report Scope 3, FLAG, due diligence, supply chain risks and climate targets.
Green claims and the risk of declarations without evidence
The EU is strengthening its approach to environmental claims. For the food industry, this means caution around terms such as “low-emission”, “regenerative”, “carbon reduced” or “climate neutral”. MRV is therefore not an add-on to communication. It is a safeguard for that communication.
How does a processing plant make money from MRV?
MRV creates financial value when data becomes part of sales, contracting, advisory work, financing and quality control. Collecting an ESG report is not enough. Data must be linked to business decisions: which farms to reward, which batches to direct to a premium customer, where to reduce risk and how to prove the result.
1. A premium for a product with evidence
Without data, the product is a standard product: frozen strawberries, juice, milk, meat, vegetables or concentrate. With MRV, the product can be sold as local, identifiable, covered by crop control, linked to a farm and environmentally documented. This does not guarantee a premium in every transaction, but it gives an argument that a supplier without data does not have.
2. Access to preferred supplier programmes
More and more large companies organise suppliers according to their ability to report ESG data, Scope 3, traceability and supply chain risk. A processor that provides data in the agreed format can become a strategic partner, not just a source of volume.
3. Insetting and reductions in the supply chain
Insetting means reducing emissions within the company’s own supply chain, for example through better fertilisation, cover crops, lower fuel consumption, reduced raw material losses, soil moisture monitoring or transport optimisation. For a processor, this is more attractive than buying external offsets, provided that reductions are measured, reported and verifiable.
Public examples from Nestlé, FrieslandCampina and Cargill show the direction of the market: financing regenerative practices, tools for measuring effects, farmer incentive programmes and linking on-farm actions with Scope 3 reductions. In financial scenarios for processors, it is worth testing payments in the range of EUR 5–25/t CO2e or payments per hectare or practice, but the specific value depends on the programme, country, raw material and methodology.
4. Better investment financing
Banks and investors increasingly analyse ESG data, financed emissions, the EU Taxonomy and supply chain risks. MRV does not guarantee cheaper financing, but it increases the credibility of a modernisation project, line expansion, energy efficiency investment or raw material programme with farmers.
In sustainability-linked loans, the economic mechanism is that meeting or missing KPIs affects the loan margin. In an analysis for a medium-sized processing plant, it is worth calculating a 10–30 bps variant, because even such a seemingly small move makes a difference when financing is measured in millions of zloty.
5. Fewer quality and operational losses
MRV data is not only about climate. If a plant can see which fields, varieties, farms and production technologies produce the best raw material, it can plan contracting, purchasing, advisory work and premiums more effectively. This connects ESG with quality.
6. Cheaper audits and faster reporting
Once collected, data can work many times: for the customer, audit, certification, ESG report, bank, grant programme, batch documentation and traceability. The biggest saving does not always come from fewer full-time positions. Often, it comes from fewer errors, faster responses and the absence of panic before an audit.
What data must be collected to document Scope 3?
To document Scope 3 emissions in processing, a company must connect data from the farm, transport, plant, packaging, quality and batches. The most important data is primary data, meaning data from a specific process, field, delivery or document, not only sector averages.
Scope 3 in food processing is often concentrated in the purchased goods and services category. In practice, this means agricultural raw materials, feed, fertilisers, plant protection products, fuel used on the farm, transport, losses, packaging and indirect energy in the chain.
For a fruit and vegetable processor, the minimum dataset includes: supplier, field, crop, variety, area, treatments, fertilisation, harvest, raw material intake, test results, transport, warehouse and production batch. For milk and meat, this is extended to data on feed, herd, welfare, animal identification, collection parameters and logistics.
| Data type | Source | Use | Example KPI |
|---|---|---|---|
| Field data | FarmPortal, advisor, farmer, machine import. | Crop history, treatments, fertilisation, yield, VRA. | Share of deliveries with a complete field history: % of batches in the season. |
| Supplier data | FoodPass, supplier register, documents, consents, certificates. | Qualification, audits, contracting, risk status. | Percentage of active suppliers with an up-to-date profile: %. |
| Quality data | Delivery inspection, laboratory, samples, audit. | Food safety, complaints, delivery selection. | Time needed to link a test result to a batch: hours. |
| Logistics data | Warehouse, transport, GPS, intake documents. | Traceability, transport emissions, delivery time. | Share of deliveries with a complete transport path: %. |
| Emissions data | Calculator, fuel, fertiliser and energy data, and emission factors. | Scope 3, ESG reporting, scenario comparison. | Emission assigned to 1 kg or 1 t of product: kg CO2e. |
Data should be created during work. The farmer records a treatment, the advisor adds a recommendation, the laboratory provides a result, the warehouse records intake, and the plant links the delivery with the production batch. This creates an evidence system, not a file archive.
How do FarmCloud, FoodPass and FarmPortal support MRV?
FarmCloud, FoodPass and FarmPortal support MRV by connecting data from farms, fields, suppliers, batches, quality, audits, sensors and reporting. Their role is not to create yet another form. The point is to build a shared data layer between the farmer, advisor, processor and customer.
FarmPortal as a source of field-level data
FarmPortal organises farm-level data: fields, crops, agronomic treatments, fertilisation, costs, observations, documents, machinery, storage, employees, satellite imagery, weather stations, soil moisture sensors, GPS trackers and elements of precision farming. A description of the functions is available on the FarmPortal farm management functions page.
FoodPass as the batch, quality and traceability layer
FoodPass works closer to the processor and distributor. It supports the supplier register, documents, audits, samples, test results, traceability, batch control and cooperation with farms. The FoodPass for traceability, quality and supply chain data page describes the approach to traceability and data in the supply chain.
FarmCloud as the integration layer
FarmCloud connects applications, sensor data, ERP and CRM systems, reporting, analytics, external tools and inter-company workflows. At the architectural level, this means that MRV data can come from many sources, but should be structured into a consistent operational model.
In practice, FarmCloud can support integrations with ERP, quality systems, WMS, BI, customer reporting systems, emissions calculators, satellite data, weather stations, ISOBUS, ISOXML and APIs of external tools. This matters because MRV is not one application. It is a data architecture.
More on FarmCloud’s approach to data and platform functions can be found on the FarmCloud as a data and integration layer for agri-food page.
Important limitation: the platform alone does not guarantee compliance with CSRD, EUDR, CSDDD or the requirements of a specific customer. Compliance depends on the scope of implementation, data quality, methodology, procedures, current regulations and the verification process.
| MRV requirement | FarmPortal | FoodPass | FarmCloud |
|---|---|---|---|
| Primary field data | Records of treatments, fertilisation, crops and observations. | Linking delivery with supplier and batch. | A consistent data model between the farm and the plant. |
| Traceability | Harvest, field, supplier, production history. | Batch, warehouse, quality, documents, audit. | Connecting data with external systems. |
| Scope 3 | Input data on treatments, yield, fertilisation and fuel. | Reporting data for the customer and audit. | Integration with calculators, BI and ERP. |
| EUDR and due diligence | Field boundaries, crops and farm data. | Data needed for the due diligence process and supplier documentation. | Data exchange between supply chain participants. |
| Audit | History of events on the farm. | Package of documents, test results and batch statuses. | Data trail from field to report. |
Source of table: FarmCloud’s own analysis based on FarmPortal and FoodPass functions and FarmCloud data architecture. The table describes the direction of system use, not automatic legal compliance.
How to implement MRV step by step?
MRV implementation should start with the product, customer and business risk, not with a form. First, it is necessary to determine which data affects sales, audits, financing and reputation. Only then should fields, statuses, integrations and reports be designed.
- Select the products with the greatest commercial importance. Priority should be given to export, private label and premium products, products covered by customer requirements, or products linked to EUDR and Scope 3 risk.
- Map suppliers, farms and fields. The minimum is to link the supplier with the farm, plots, crops, documents, consents, certificates and delivery history.
- Define field and quality data. For crops, this includes treatments, fertilisation, yield, irrigation, observations, soil analyses, satellite images and test results.
- Link data with batches. Test results, samples, delivery inspections and certificates should be assigned to the batch, supplier, date and place.
- Set the reporting methodology. For emissions, it is necessary to define system boundaries, the functional unit, emission factors, data sources and how missing data is handled.
- Introduce data quality control. The system should detect gaps, inconsistent dates, expired documents, incomplete batches and suppliers without up-to-date data.
- Prepare reports for different audiences. Management needs KPIs, the customer needs data for the scorecard, the auditor needs an evidence trail, and the advisor needs a list of farms requiring action.
In practice, the biggest problem is rarely the application itself. More often, it is the lack of a shared definition of batch, supplier, field, season, document status and data responsibility between purchasing, quality, advisory and production teams.
Case study: a fruit and vegetable processor with 300 suppliers
The following scenario shows a realistic way to calculate the effects of MRV in a Polish fruit and vegetable processing plant. The figures are indicative and should be verified for the specific plant, production profile, customer, emissions methodology and integration scope.
Case study: a medium-sized frozen-food processor in Poland, 300 suppliers, around 2,400 ha of contracted crops, with a production profile including strawberries, raspberries, cherries, broccoli, peas and green beans.
Problem
The plant worked with large B2B customers and retail chains. Successive requests began to include requirements relating to raw material origin, treatment history, residues, carbon footprint, supplier data and the ability to generate a customer report. Some of the data was available, but it was stored in spreadsheets, emails, the warehouse system, quality documents and advisors’ notes.
Solution applied
The processor started with three products of the highest commercial importance. Suppliers were assigned to fields and crops; documents, certificates and consents were organised; and raw material intake was linked with production batches. At the same time, advisors began collecting data on treatments, fertilisation, yield, observations and quality risks in FarmPortal, while the plant used FoodPass as the quality, document and traceability layer.
Input data
- number of suppliers covered by the first stage: 180 out of 300,
- number of fields assigned to suppliers: around 1,150,
- scope of field data: crop, variety, treatments, fertilisation, observations, harvest, documents,
- scope of plant data: raw material intake, quality control, samples, test results, warehouse, production batch,
- scope of reporting data: data completeness status, batch-to-field link, audit pack, customer data.
KPIs after the first season
| KPI | Starting situation | After the first season | Business significance |
|---|---|---|---|
| Suppliers with a complete profile | around 35% | around 80% | Faster supplier qualification for customer programmes. |
| Batches linked to fields | around 40% | around 85% | Better trace-back, trace-forward and complaint handling. |
| Average time to prepare an audit pack | 5–7 working days | 1–2 working days | Less manual work before an audit and customer response. |
| Deliveries with complete documents at intake | around 55% | around 88% | Fewer documentation blocks and post-delivery corrections. |
| Farms covered by advisory monitoring | around 70 | around 180 | Better control of quality risk before harvest. |
Financial effect in a management scenario
| Source of effect | Assumption | Annual effect | Comment |
|---|---|---|---|
| Defending margin in a B2B contract | 4,000 t of product × PLN 20–40/t | PLN 80,000–160,000 | The effect depends on the market, customer and strength of data in negotiation. |
| Faster audits | 6 audits per year, shortening work by 3–5 days per audit | 36–90 working days of team time | The greatest value is faster response and fewer errors, not just the cost of hours. |
| Investment loan | PLN 30 million, 10–30 bps margin-difference scenario | PLN 30,000–90,000 per year | Requires KPI agreement and bank acceptance. |
| Insetting among suppliers | 5,000 t CO2e reduction × EUR 5–25/t | EUR 25,000–125,000 in programme value | This is not automatic profit, but a budget or reduction value in the chain. |
| Risk of losing a contract | 1 private label contract worth PLN 2–5 million | revenue retained or lost | MRV does not guarantee a win, but missing data can exclude a supplier from the shortlist. |
Source of tables: FarmCloud operational scenario based on typical processes in a fruit and vegetable processing plant. The figures are indicative and should not be published as the result of a real implementation without confirmation from the customer.
Conclusion
The biggest change was not that the plant “had more data”. The change was that the data became useful: for purchasing, quality, advisors, audits, the customer, the bank and management. That is the difference between a document archive and MRV.
Who in the organisation uses MRV?
MRV creates value because it organises the language of data between departments. Management looks at risk and margin, purchasing at suppliers, quality at batches and documents, advisors at farms, and R&D consortium partners at measurable implementation effects.
Fruit and vegetable processors
The main problem for this group is scale and seasonality. A plant may work with hundreds of farms, thousands of plots and many varieties, while also needing to respond quickly to quality, residues, raw material availability and customer requirements.
MRV helps determine which farms deliver the best-quality raw material, where documentation risks occur and which batches can be sold with a stronger traceability narrative. The first step is a map of suppliers, fields, batches and data gaps.
Agri-food management teams
Management needs an answer to whether MRV is a cost or an investment in market access. The language of this group is margin, risk, financing, contracts, audits, reputation and negotiating advantage.
The most important decision concerns prioritisation. If a company has a limited budget, it should not start with all products and all suppliers. It is better to choose the chains where missing data can restrict sales most quickly.
R&D consortium partners
Research and development project partners need data that can be measured before and after implementation. MRV supports projects relating to regenerative agriculture, emissions reduction, raw material quality, the digital twin of a crop, sensors, remote sensing and decision models.
For this group, KPIs, methodology, sample control, data versioning and auditability are important. Without these, an R&D project may produce interesting conclusions, but it is harder to turn them into a repeatable system.
MRV readiness checklist
An MRV checklist helps determine whether the company is ready for a discussion with a customer, auditor or bank. If most answers are “we do not know” or “we have it in different files”, the first project should be to organise the source data.
- Can every raw material batch be linked to a supplier, farm and field?
- Does the company have an up-to-date register of suppliers, consents, certificates and quality documents?
- Is the history of treatments, fertilisation and harvest available in digital form?
- Are laboratory test results assigned to a batch, date, supplier and product?
- Is it clear which data is primary and which comes from average or default indicators?
- Does the company have one definition of batch, season, supplier, field and document status?
- Do quality, purchasing, advisory and production teams work on a consistent data model?
- Can a customer report be generated in days, not weeks?
- Does the system store the history of changes and enable audit of the evidence trail?
- Does management see MRV KPIs, not just individual files with data?
- Can the finance team calculate the impact of MRV on margin, audits, financing and the risk of losing a contract?
FAQ
What does MRV mean in food processing?
MRV stands for monitoring, reporting and verification, meaning the measurement, reporting and verification of data. In food processing, it covers data on suppliers, fields, treatments, batches, quality, transport, emissions and documents. The goal is to create an evidence trail that can be shown to a customer, auditor, bank or regulator.
How much does missing MRV cost?
The cost of missing MRV is rarely a single line item in the budget. Most often, it appears as a lower selling price, a lost contract, a longer audit, more manual work, a weaker supplier assessment or poorer access to finance. A company pays for missing data through margin, team time and credibility with the customer.
How can the financial effect of MRV be calculated?
It is worth calculating at least five elements: margin per tonne of product, the value of contracts dependent on data, the cost of audit-related work, the impact on financing and the value of an insetting programme. For a PLN 30 million loan, a 10–30 bps margin difference means around PLN 30,000–90,000 per year.
Why is Scope 3 important for a food processor?
Scope 3 covers indirect emissions in the value chain, including agricultural raw materials, fertilisation, feed, transport, packaging and waste. For many processing plants, the largest environmental impact is not in the factory itself, but among suppliers. Without data from farms, a Scope 3 report is based mainly on average indicators.
How can Scope 3 emissions be documented in processing?
A company needs to build a supplier and field database, define the calculation methodology, obtain primary data from farms, link it to the production batch in the plant and prepare a report in the format required by the customer. Data sources, system boundaries, the functional unit and how gaps are treated are all important.
Does EUDR apply to Polish dairy or frozen-food processors?
EUDR applies to specific commodities and products, including cattle, cocoa, coffee, palm oil, soy, rubber and wood. Milk as such is not directly covered, but the chain may include soy-based feed. Frozen fruit and vegetables usually require analysis of composition and auxiliary raw materials, not an automatic assumption.
Does FoodPass replace an ERP system?
FoodPass does not have to replace ERP. It can serve as a layer for supplier cooperation, quality, audits, traceability and supply chain data. In many organisations, the best effect comes from integration: ERP handles financial and warehouse processes, while FoodPass organises supplier, batch, document and control data.
How does FarmPortal help farmers with MRV?
FarmPortal helps farmers keep digital records of fields, crops, treatments, fertilisation, costs, observations, documents and sensor data. This means the farmer does not have to reconstruct production history after the season. The data can support advisory work, traceability, quality programmes and reporting for the processor.
How is MRV different from ordinary traceability?
Traceability answers the question of where a batch came from and where it went. MRV adds a layer of data on how the raw material was produced, what environmental parameters it has, which documents confirm this and whether the result can be verified. A good traceability system is part of MRV, but MRV is broader.
Can MRV support regenerative agriculture programmes?
Yes, if the programme has a clear methodology, baseline, data scope and verification method. MRV can document cover crops, reduced tillage, fertilisation, retention, yield, soil practices and test results. Without comparable data, a regenerative programme remains a declaration rather than a measurable process.
Where should MRV implementation in a plant begin?
The best place to start is with one product chain and a group of suppliers that matter commercially. The first stage should include a data map, supplier register, linking batches with fields, a list of documentation gaps and customer requirements. Only then is it worth expanding the scope to emissions, sensors and advanced reports.
Glossary
- MRV
- Monitoring, reporting and verification: a system for measuring, reporting and verifying data. In agri-food, it is used to document origin, emissions, quality, production practices and the credibility of claims.
- Scope 3
- Indirect greenhouse gas emissions in a company’s value chain. In food processing, they often include agricultural raw materials, fertilisers, feed, transport, packaging, waste and the use of sold products.
- SBTi FLAG
- The Science Based Targets initiative methodology for emissions related to forests, land use and agriculture. It is important for food companies because it covers agricultural emissions and deforestation.
- PCAF
- The Partnership for Carbon Accounting Financials, a standard and initiative that helps financial institutions calculate financed emissions.
- GAR
- Green Asset Ratio, an indicator used by banks in the context of EU Taxonomy-aligned exposures. It influences the questions banks ask borrowers about environmental data.
- SAI Platform FSA
- Farm Sustainability Assessment, a tool for assessing sustainable agriculture practices in food and beverage supply chains.
- Cool Farm Tool
- A tool for calculating a farm’s impact on greenhouse gas emissions, water, biodiversity and food loss. It requires farm-level input data.
- Supplier scorecard
- A supplier assessment card used by a B2B customer. It may cover price, quality, punctuality, ESG data, carbon footprint, traceability, supply chain risks and data completeness.
- Primary data
- Data coming directly from the farm, plant, sensor, document or process. It usually has stronger evidential value than average data because it describes a specific supply chain and a specific batch.
- CSRD
- The Corporate Sustainability Reporting Directive, the EU directive on sustainability reporting. It increases the importance of ESG data and transfers information pressure to the suppliers of large companies.
- EUDR
- The European Union Deforestation Regulation, a regulation concerning deforestation-free products. Among other things, it requires due diligence and origin data for selected commodities and products.
- CSDDD
- The Corporate Sustainability Due Diligence Directive. The directive concerns corporate due diligence in operations and value chains, including identifying and mitigating negative environmental and social impacts.
- DDS
- Due Diligence Statement, a statement of due diligence used in the context of EUDR. It requires data on origin, risk and compliance for selected commodities.
- VRA
- Variable Rate Application, meaning the variable application of fertilisers, inputs or seeds based on maps, soil data, yields, sensors or satellite imagery.
- ISOXML and ISOBUS
- Standards and formats related to agricultural machinery data exchange. In MRV, they can support the import of data on treatments, fertiliser application, sowing, spraying and machine work.
Summary
MRV in food processing is no longer an add-on to an ESG report. It is a data layer that determines audit speed, offer strength, supplier scorecard position, traceability quality and the ability to defend environmental claims.
A processor without MRV sells a product that is easy to compare by price. A processor with MRV sells a product with proof: of origin, control, quality, environmental data and responsibility in the supply chain.
The most practical first step is a data map: suppliers, fields, batches, documents, test results, treatment history, customer requirements and gaps in the current process. Only on that basis is it worth designing integrations, Scope 3 reports, EUDR data, digital product passports, regenerative programmes and advanced analytical models.
Whoever has the data can defend the price. Whoever does not, competes mainly on cost.
Follow us!
Preview what we are doing and be inspired by positive changes.