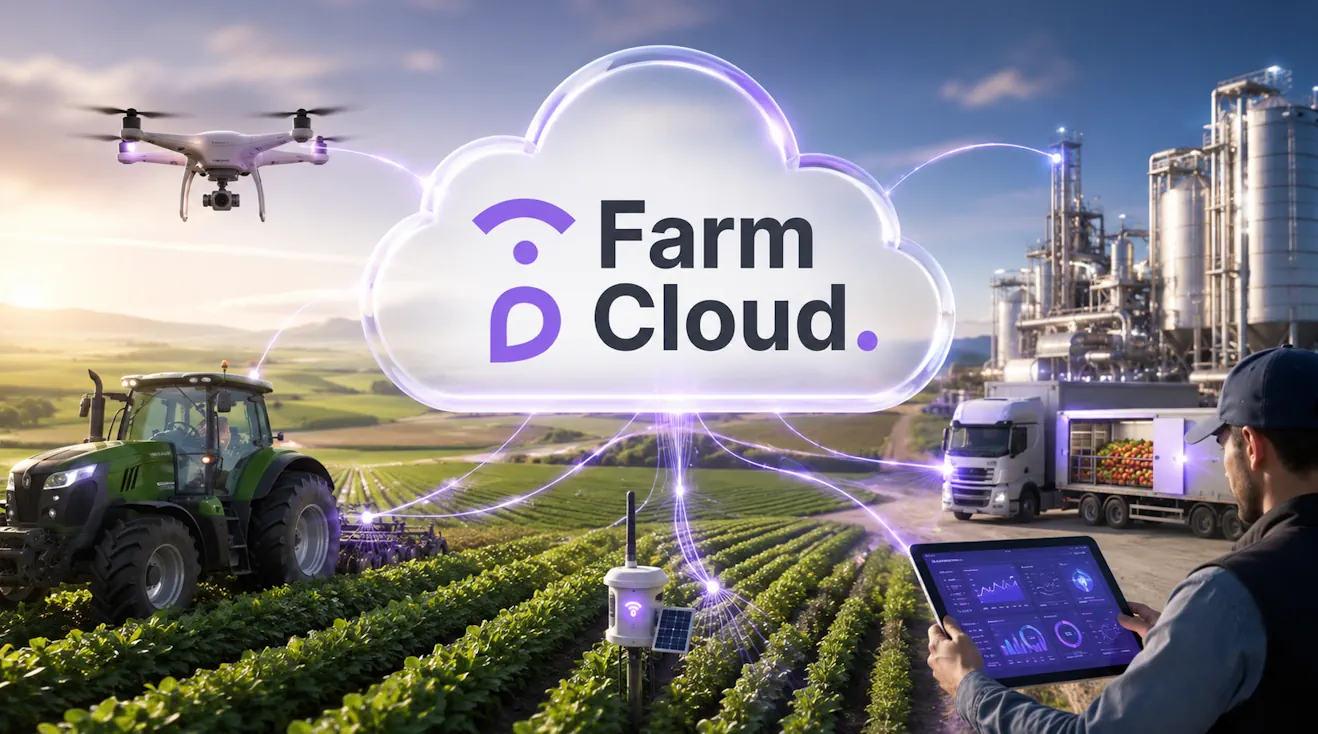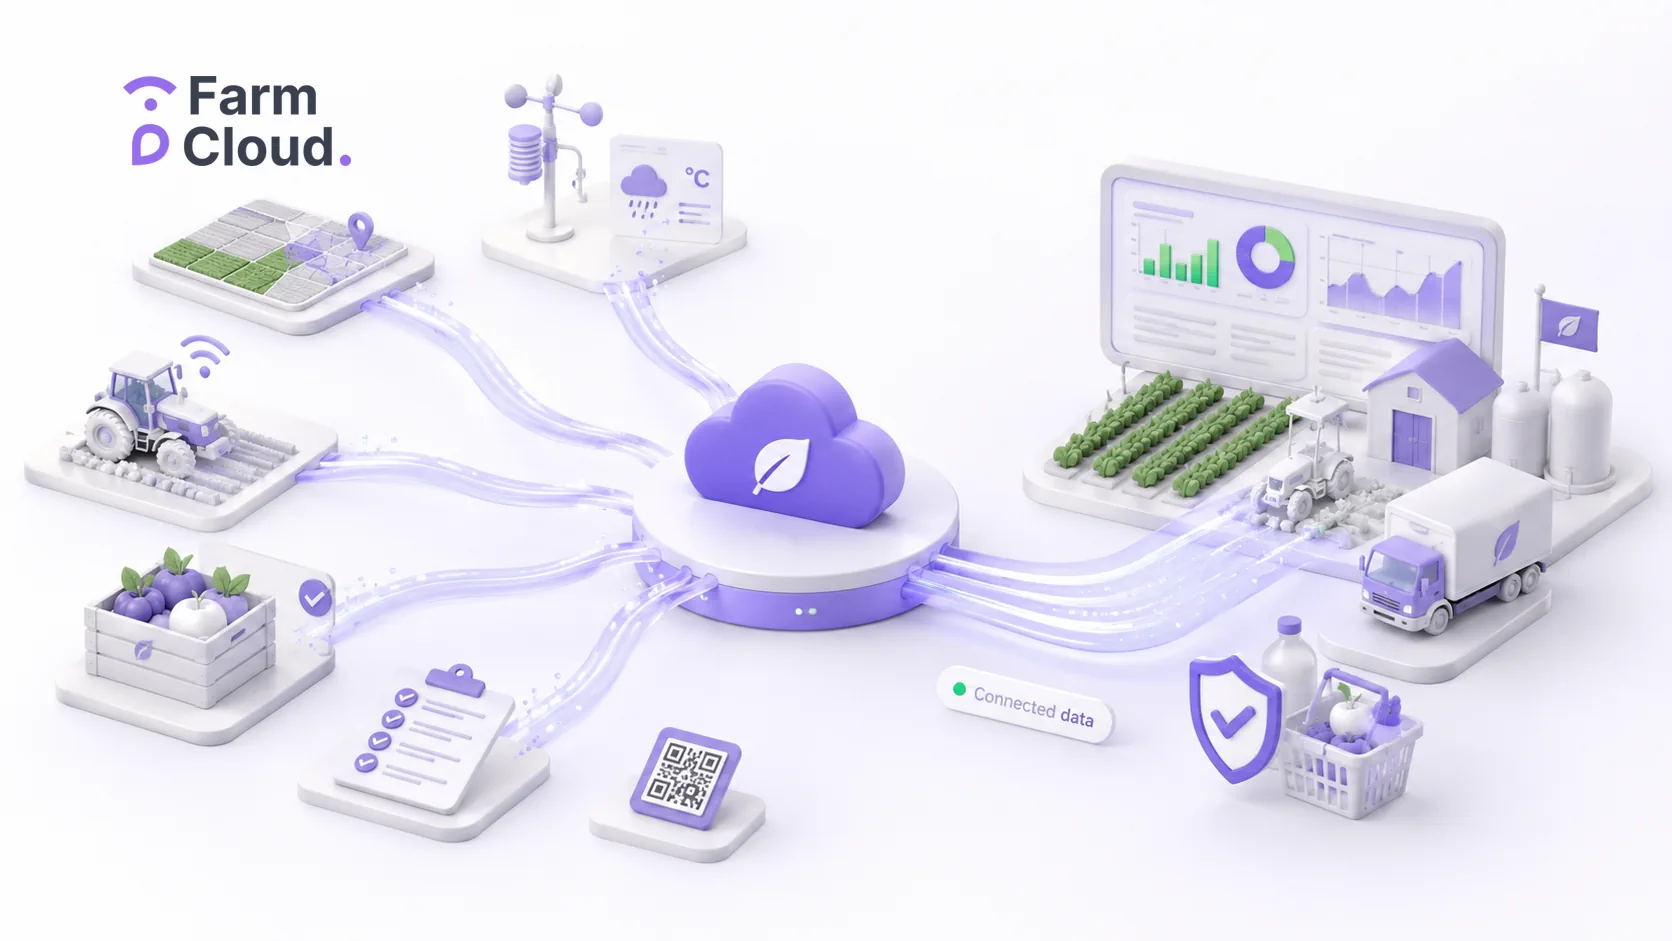
FarmCloud is a data platform for agri-food that connects information from fields, crops, machines, sensors, ERP systems, advisory work, quality control and the supply chain into one operating model.
At a glance
Agriculture no longer suffers from a lack of data. It suffers from a lack of connections. Data from agricultural machinery, a Farm Management System, weather sources, ERP and delivery documentation only become valuable when they can be assigned to a field, delivery, batch, treatment or event.
- The main problem in farm digitalisation is not a lack of data, but the lack of a single history of the field and batch.
- The Farm to Fork strategy starts with connecting field, quality and delivery data.
- According to Agri Solutions’ own data, FarmCloud integrates more than 25 data sources.
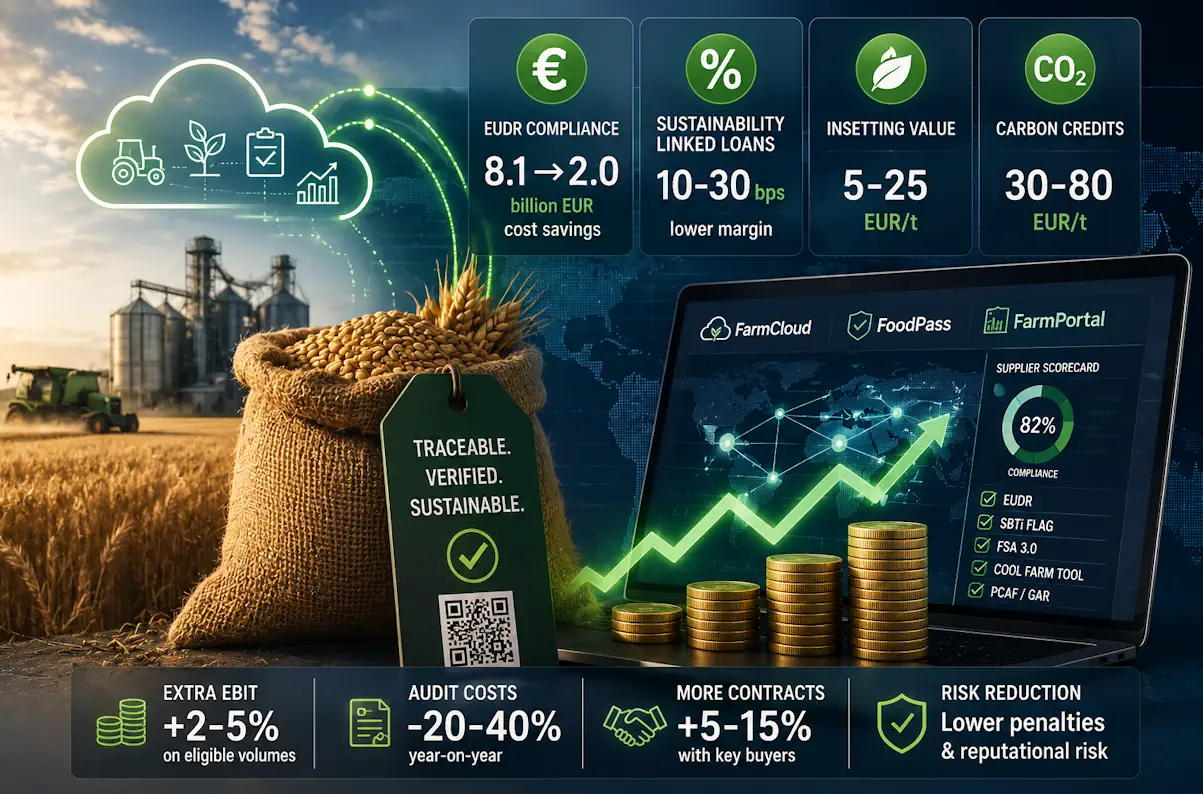
- FoodPass organises batches, deliveries, audits and quality; FarmPortal adds the field history.
Data fragmentation in agriculture: what does it really mean?
Data fragmentation in agriculture is the point at which data exist, but do not help with a decision. An ISOBUS terminal knows the machine pass, the adviser remembers the recommendation, ERP sees the intake of raw material, the quality team has the test result, and the grower has a photo on their phone. The problem starts when those five traces have to be turned into one field or batch history.
A line needs to be drawn here: an application that does not connect with the rest of the process is not digitalisation. It is another shelf for data. In a quiet week, nobody notices. When there is a batch complaint, an IFS audit or a customer question about Scope 3, people start searching through colleagues, emails and spreadsheets.
This is not just a problem for one company after the season. A 2025 study by the European Commission and the JRC, covering 1,444 farms in nine EU countries, including Poland, shows a similar pattern: widespread use of basic IT, slower adoption of more expensive production technologies and still a great deal of manual data collection on farms.
Where does information chaos come from on farms and in processing plants?
The mess is not caused by laziness. Each department patches its own part of the work: the mechanic enters machine service in a separate file, the agronomist sends a recommendation by message, the warehouse records delivery intake in ERP, and the quality team stores photos and certificates in folders. Separately, it works. Together, it loses context.
The worst moment comes when the trace has to be followed back. A complaint arrives a few days later, or after dispatch. The quality team has to establish which delivery fed into the batch, which field the raw material came from, and whether someone entered the sample result in the right place. When the batch number does not connect product movement with field history, the phone calls begin: warehouse, purchasing, adviser. Time slips away.
For advisers, the gap is more human. Knowledge about a client’s fields sits in the adviser’s head, in inspection photos and in messages sent after a visit. When someone takes over the region, they do not inherit the full history. They do not know where frost hit in spring, which plots saw disease pressure return, or where the farmer changed the fertiliser rate “as a trial”.
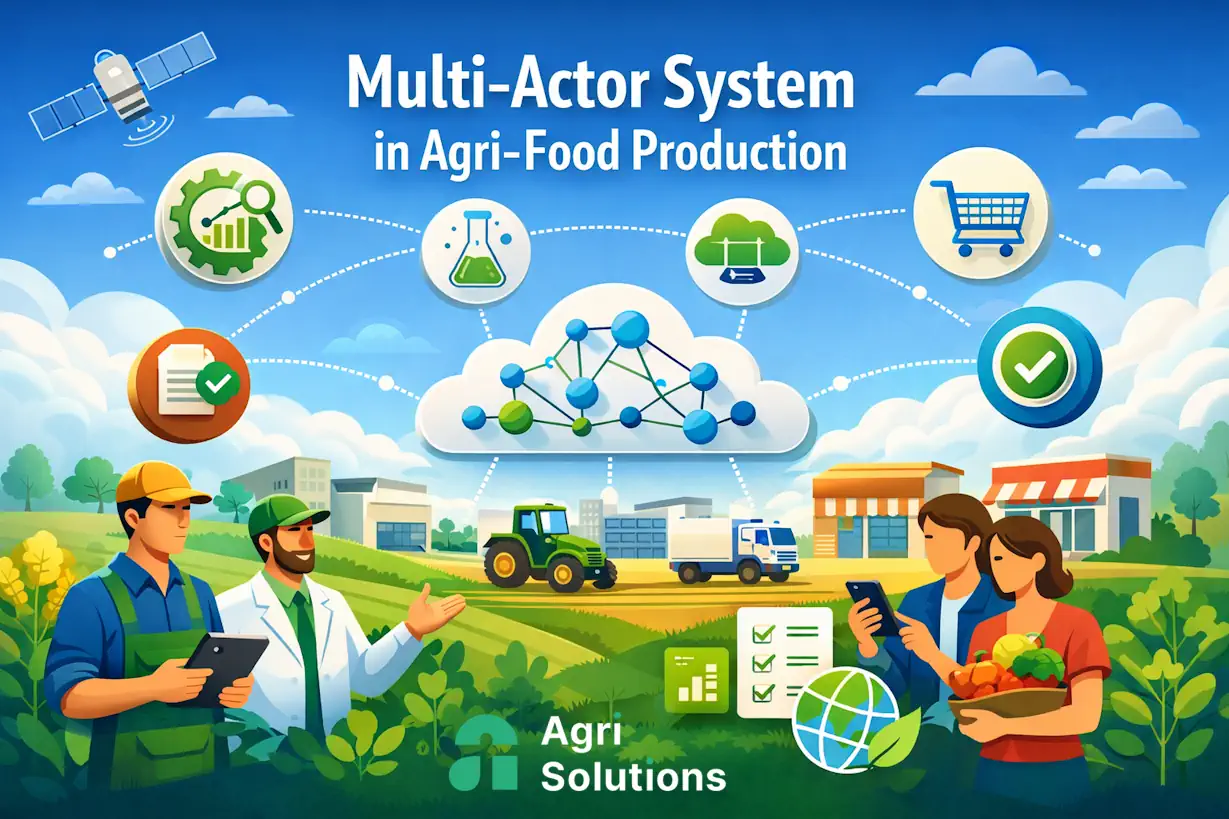
In Agri Solutions’ interviews and surveys with 17 Polish foodtech and processing companies, the same issue kept coming back: there is a lot of data, even more systems, and the decision still often starts with a call to the person who “knows where it is”. Companies bought tools point by point. Integration came later, sometimes only when an audit forced the issue.
Which data needs to be connected from farm to fork?
The path from farm to fork does not happen in one rhythm. A crop protection treatment is carried out on the farm in the morning, the satellite updates the field image on a cycle, the delivery reaches the ramp within hours, the laboratory result comes later, and a quality document may only be needed during an audit. The system has to cope with those delays and still stitch the evidence together.
The Farm to Fork strategy in the European Commission’s COM(2020)381 document sets out the goals of a sustainable food system, including reductions in the use and risk of pesticides, reduced fertiliser use and growth in organic farming. In the plant, the slogan matters less than the proof: can you show what happened between the field and the product batch?
| Data source | Example information | Typical owner | Risk without integration | Role in FarmCloud |
|---|---|---|---|---|
| Field and crop | field boundaries, variety, treatments, fertilisation | farmer, agronomist | no field trace at delivery intake | FarmPortal as the farm management system |
| Machines | passes, fuel, application rates, ISOXML, CAN-bus | operator, farm manager | manual re-entry of work and application rates | integration of machine data and telemetry |
| Weather and IoT | rainfall, humidity, Delta-T, frost, soil moisture | farm, adviser | no evidence of treatment conditions | sensors, weather stations, disease models |
| Deliveries and quality | batch, weight, sample, rejection, photos, certificate | processor, quality team | overly broad recall and raw material hold | FoodPass as the batch and quality layer |
| ERP, WMS and documents | contracts, invoices, stock, audit documentation | company, finance, logistics | operational decisions without field data | integration layer, API, ETL, Private Service |
An NDVI or NDRE map rarely gives the answer on its own. It shows that something is different. Only when it is connected with the variety, treatment, rainfall, temperature, inspection photo and adviser’s comment can you see whether the problem was drought, disease, fertilisation or an execution error.
Why are apps alone not enough?
Apps alone are not enough. A screen does not fix the flow of data. A farmer may have weather in one app, a machine pass in a terminal, soil tests in a PDF, inspection photos on a phone and a treatment register in a spreadsheet. Without a shared field and batch identifier, those are still five versions of the same reality.
The argument about a Farm Management System is straightforward. As a digital notebook, an FMS helps the farmer. For a processor or adviser, it starts to work only when it becomes a source of field data for a wider ecosystem. Otherwise, the Farm to Fork strategy ends in a PDF export and a manual email attachment.
Standards are necessary, but they do not replace responsibility. ISO 11783, known in practice as ISOBUS, structures communication between the tractor, implement, terminal and tool. GS1 helps identify products, locations and batches. APIs move data between systems. Someone still has to decide who approves a supplier, who changes a batch number and who corrects an error after delivery.
| Process | Fragmented model | Integrated model | Impact on decisions |
|---|---|---|---|
| Agronomic recommendation | note, SMS, photo, no field history | inspection, GPS photo, weather, recommendation and status in one view | faster execution checks and fewer gaps when an adviser changes |
| Machine operation | application rate in the terminal, report elsewhere, fuel elsewhere | agricultural machine data connected with the field, crop and operator | less retyping, better costing and better documentation |
| Raw material intake | weight and quality in the plant system, field in the supplier’s knowledge | delivery connected with the field, batch, sample and documents | narrower trace-back during a complaint or quality check |
| ESG or Scope 3 report | average indicators, manual surveys, no primary source | data on fuel, fertilisers, treatments, yields and deliveries | fewer assumptions, more audit-ready data |
The Data Act, applied in the EU from 12 September 2025, increases the importance of access to data from connected products. For agri-food, that is a signal that data policy, permissions and technical interfaces must be in place before a dispute arises over machine or sensor data.
How do FarmCloud, FoodPass and FarmPortal organise data?
FarmCloud should not be another login screen. Its role is different: to connect systems, devices and processes that already operate inside the company. The publicly described FarmCloud integration layer covers IoT sensors, external data providers, IT systems, APIs, ETL and Private Service.
FoodPass starts where field data meet the plant: at the supplier, delivery, batch, sample, document, audit and quality decision. Each delivery can receive a digital passport: number, source, quality parameters, event log and link to the farm. Without that passport, recall is broader than it should be.
FarmPortal captures what happens in the field: crops, treatments, fertilisation, employees, machines, documentation, inspections, GPS photos, VRA and signals from decision-support systems. In the FarmCloud ecosystem, FarmPortal as a source of field data feeds FoodPass, reporting and advisory work.
According to Agri Solutions’ own data, FarmCloud already integrates more than 25 data sources, including IoT, weather, ERP, CRM, satellite data, weather stations, telemetry, ISO-BUS, CAN-bus, files and external providers. The number of sources is not a success in itself. Success means shorter trace-back, less retyping and fewer decisions made from one employee’s memory.
Installation on the client’s servers is not an add-on for show. It makes sense when data are sensitive, the organisation has its own security requirements, or FarmCloud has to be connected with internal systems. In the Private Service model, ETL processes, custom modules and integrations with the client’s data warehouse can be built.
What do processors, foodtech companies and advisers gain?
For a processor, the gain is most tangible on the day of a complaint or audit. From a product batch, the team has to get to the delivery, farm and field without searching through the mailbox. A narrower raw material hold, faster document preparation and a calmer conversation with a retail chain are the result of well-connected identifiers.
A foodtech company does not build a risk model on an API alone. It needs data from farms, its own systems and external sources at the same time. When they are not held in one model, the team first maps formats and only then starts thinking about a recommendation, report or supplier score. FarmCloud can work as a digital platform for agriculture onto which the company adds its own business logic.
Advisers and agronomists gain continuity. Field history, inspection photos, recommendations, weather and treatment execution do not disappear when a region changes hands or a season ends. That matters when working with several dozen growers, where one person’s memory quickly becomes the bottleneck.
The quality team does not need another folder called “audit 2026”. It needs evidence attached to the place where the data were created: field, delivery, sample or batch. Traceability and passporting functions in FarmCloud are only practical when the evidence does not detach from the process.
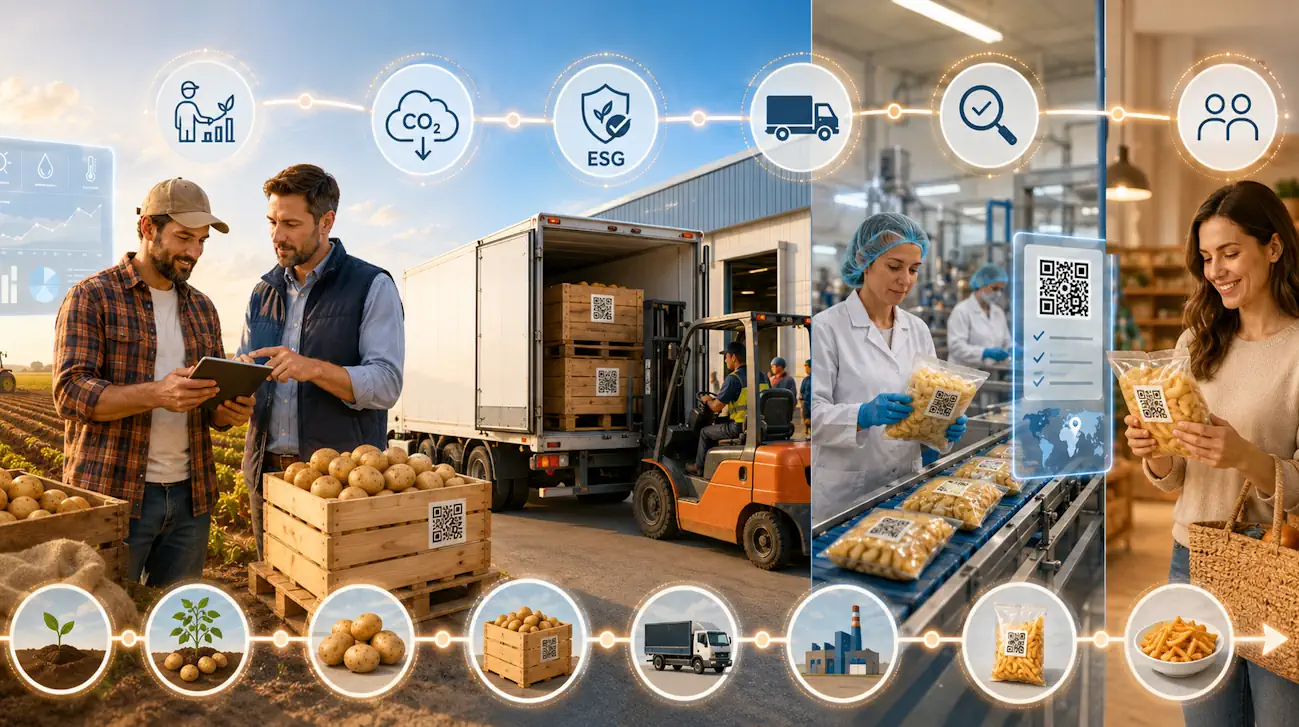
Case study: fruit and vegetable processor
Example prepared for this article on the basis of real FarmCloud implementation cases.
A fruit and vegetable processor works with 120 suppliers, around 2,800 ha of contracted fields and two plants. Before the project, purchasing works in ERP, the supplier list lives in spreadsheets, certificates are stored in folders, the laboratory sends reports separately, and advisers pass some information on in messages after field inspections.
Then a complaint arrives for a batch of frozen vegetables. There is a batch number. What is missing is a quick route back to the field, treatment, weather and sample result. The quality team blocks a larger volume because nobody wants to release raw material on the basis of a guess.
In the target model, FoodPass organises suppliers, deliveries, samples, audits and batches. FarmPortal collects field data. FarmCloud connects both areas with ERP, the laboratory, weather and telemetry from selected machines. The first stage is narrow: one raw material category, 35 suppliers, one season. Without that discipline, it is easy to drown.
| KPI | Before integration | After the pilot stage | Data source | Interpretation limit |
|---|---|---|---|---|
| Batch trace-back time | 4–8 hours | 20–45 min | process model | depends on the quality of batch numbering |
| Number of document storage locations | 7 | 2 | process mapping | does not include historical archives |
| Suppliers in the portal | 0 out of 35 | 31 out of 35 | pilot scenario | requires onboarding support |
| Events with field and location | partial | treatments, inspections, GPS photos | FarmPortal | quality depends on user discipline |
The lesson from the pilot is not glamorous, but it is decisive: identifiers first. Field, supplier, crop, delivery, sample, batch, document and quality decision have to connect. Only then do analytics, ESG, disease models and management reports have something to work with.
Limitations and implementation mistakes
Agricultural data integration makes no sense if the company cannot name the decision it wants to improve. Connecting everything to everything sounds ambitious, but it usually becomes an expensive IT project. It is better to choose one route: batch, delivery, field, treatment, sample, result.
First mistake: moving chaos into the system. If suppliers are duplicated, fields are named in different ways and batches have manual exceptions, integration only produces errors faster. Before APIs, dictionaries, roles, numbering and responsibility have to be cleaned up.
Second mistake: leaving the people in the field out of the design. Farmers and operators will not enter data simply because the quality department has an audit in three months. Data have to be created during the work itself: during a treatment, field inspection, delivery intake or sample collection.
Third mistake: believing that satellites and AI can explain the field by themselves. NDVI detects differences in crop condition, but it does not know the cause. A system can collect evidence and speed up an audit, but it does not replace legal interpretation or the certifier’s decision.
Data clean-up checklist
Start with the process that really hurts: delivery and batch for a processor, field history for an adviser, access to primary data in a foodtech company, or telemetry for a machine manufacturer. The rest can wait.
- Choose one raw material category, region or group of 20–40 suppliers.
- Define the identifiers: farm, field, crop, delivery, sample, batch, document.
- Check which data are created in FarmPortal, FoodPass, ERP, the laboratory, machines and files.
- Assess which data are primary, which have been re-entered and which are only declarations.
- Set access rights: farmer, adviser, quality, purchasing, management, integrator, external auditor.
- Launch a pilot with one metric, such as batch trace-back time or completeness of supplier documentation.
- Only after the pilot, connect wider API, ETL, ERP, WMS, telemetry and data warehouse integrations.
This list shows why implementation of the Farm to Fork strategy does not start with a report, but with data from fields, deliveries, samples and batches. False compliance is the worst version: the document exists in the system, but it is not linked to a specific event.
FAQ
What does data fragmentation in agriculture mean?
Data fragmentation in agriculture means that information about fields, treatments, machines, weather, deliveries, quality and documents sits in many different places. The data exist, but they cannot be quickly connected with a decision, product batch or audit. That increases manual work and the risk of error.
Why are agricultural data so scattered?
Data are scattered because each process historically received its own tool: a machine terminal, weather app, Excel file, ERP, adviser’s notes, field photos and quality binder. Agriculture is seasonal, field-based and involves many participants, so integration often comes later than data collection itself.
Does a Farm Management System solve the problem on its own?
No. A Farm Management System helps manage the farm, but an FMS alone is not enough if it does not connect with deliveries, quality, ERP, machines, sensors and the supply chain. In the FarmCloud ecosystem, FarmPortal provides field data, while FoodPass connects them with batches, documents and processor workflows.
Which agricultural machine data are most valuable?
The most valuable data are those connected with a field and task: working time, GPS pass, fuel use, application rate, working width, operator, implement and ISOXML file. Machine traces alone are interesting, but a decision is supported only when they are linked to the crop, treatment, cost and result.
How do satellite data in agriculture support integration?
Satellite data in agriculture help detect differences in crop condition, but they need to be connected with the field history. An NDVI or NDRE index should be analysed together with rainfall, fertilisation, variety, field inspection and treatments. Otherwise, it shows the symptom, not the cause.
How should a processor start integrating agricultural data?
Start with one batch route: raw material, supplier group, season and plant. Connect the farm, field, delivery, sample, quality result and batch number. Once that process works, then connect ERP, WMS, the laboratory, telemetry and ESG reporting.
Does data integration help with the Farm to Fork strategy?
Yes, because the Farm to Fork strategy requires evidence, not just declarations. A processor has to connect data on the crop, treatments, fertilisation, delivery, quality, transport and batch. Without that, it is difficult to move from a transparency claim to an auditable process.
How should the effects of a digital platform for agriculture be measured?
Measure operational effects: batch trace-back time, completeness of supplier documentation, number of manual entries, share of deliveries linked to a field, audit preparation time and errors in numbering. Yield or cost per hectare matters too, but it also depends on weather, soil and prices.
Glossary
- Traceability
- The ability to identify the path of a raw material or product both backwards and forwards. In practice, it means connecting a batch with the supplier, field, sample, documents and recipient.
- Batch number
- An identifier that connects physical raw material or finished product with a digital event history. Without a batch number, recall covers too broad a scope.
- Product passport
- A data set covering origin, quality, documents, events and product parameters. In FoodPass, the batch passport connects data from the field, delivery, quality and supply chain.
- Farm Management System
- A system for managing the farm, fields, crops, treatments, employees, machines and documentation. FarmPortal fulfils this role in the FarmCloud ecosystem.
- ISOBUS and ISOXML
- A standard for communication and data exchange between agricultural machines, implements and terminals. It helps transfer tasks and reports, for example in variable rate application (VRA).
- CAN-bus
- A communication bus used in machines and vehicles. In agriculture, it can provide data on machine operation, fuel, load or selected technical parameters.
- NDVI and NDRE
- Vegetation indices derived from satellite or drone data. They help monitor crop condition, but they need to be interpreted together with weather, soil, fertilisation and field observation.
- MRV
- Monitoring, reporting and verification of environmental data. In agri-food, this includes fuel, fertilisers, treatments, yields, emissions, farming practices and delivery data.
Summary and next step
Data fragmentation in agriculture is a hidden cost that most often appears too late: during a complaint, audit, adviser change or supplier settlement. The data are there, but they do not work if the field, machine, person, weather, document, delivery and batch do not share a common history. Farm digitalisation then looks good in a presentation. On the intake ramp, less so.
The simplest test is this: take one product batch and try to get from it to the field, treatment, supplier, sample and documentation in less than an hour. If you cannot do it, you are not missing another report. You are missing a data architecture.
FarmCloud, FoodPass and FarmPortal organise that architecture through a shared data layer. They do not do people’s work for them and they do not fix poor dictionaries. What they do is enforce precision: who entered the data, what they are assigned to, where they were created and who may use them. That is where agricultural data integration starts.
Sources and data currency
Current as of 1 July 2026. This article uses: JRC, “The state of digitalisation in EU agriculture”; European Commission, COM(2020)381, “A Farm to Fork Strategy”. Further text references: European Commission Data Act, Green Forum EUDR implementation, GS1 Global Traceability Standard, ISO 11783, FarmCloud, FoodPass and FarmPortal materials.
Follow us!
Preview what we are doing and be inspired by positive changes.